Project Examples
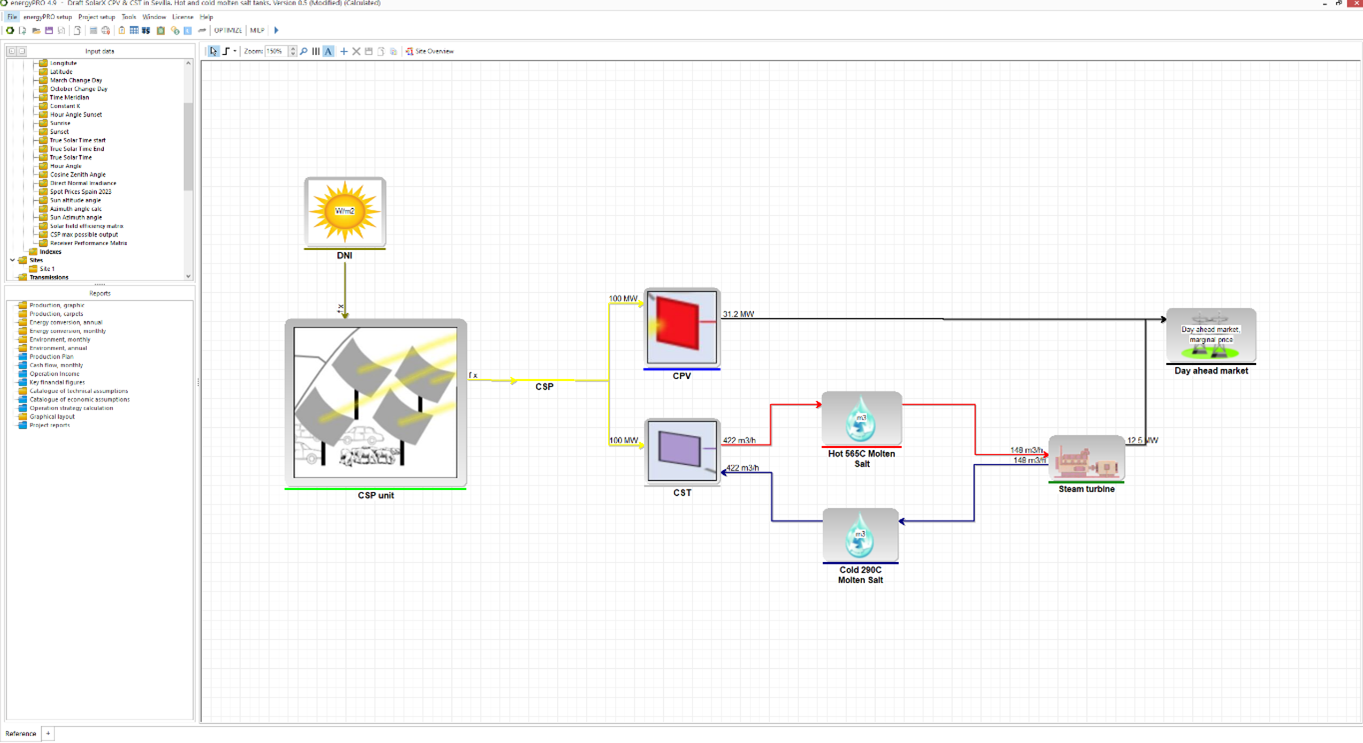
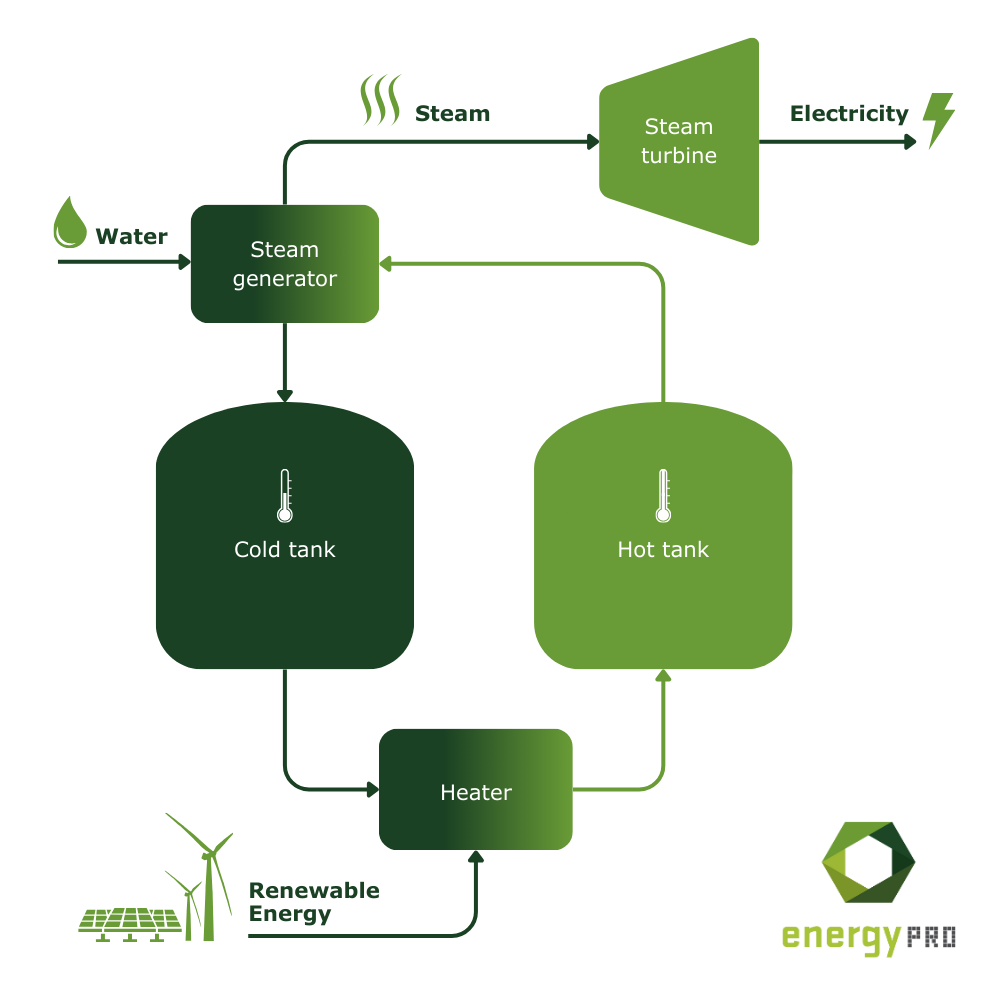
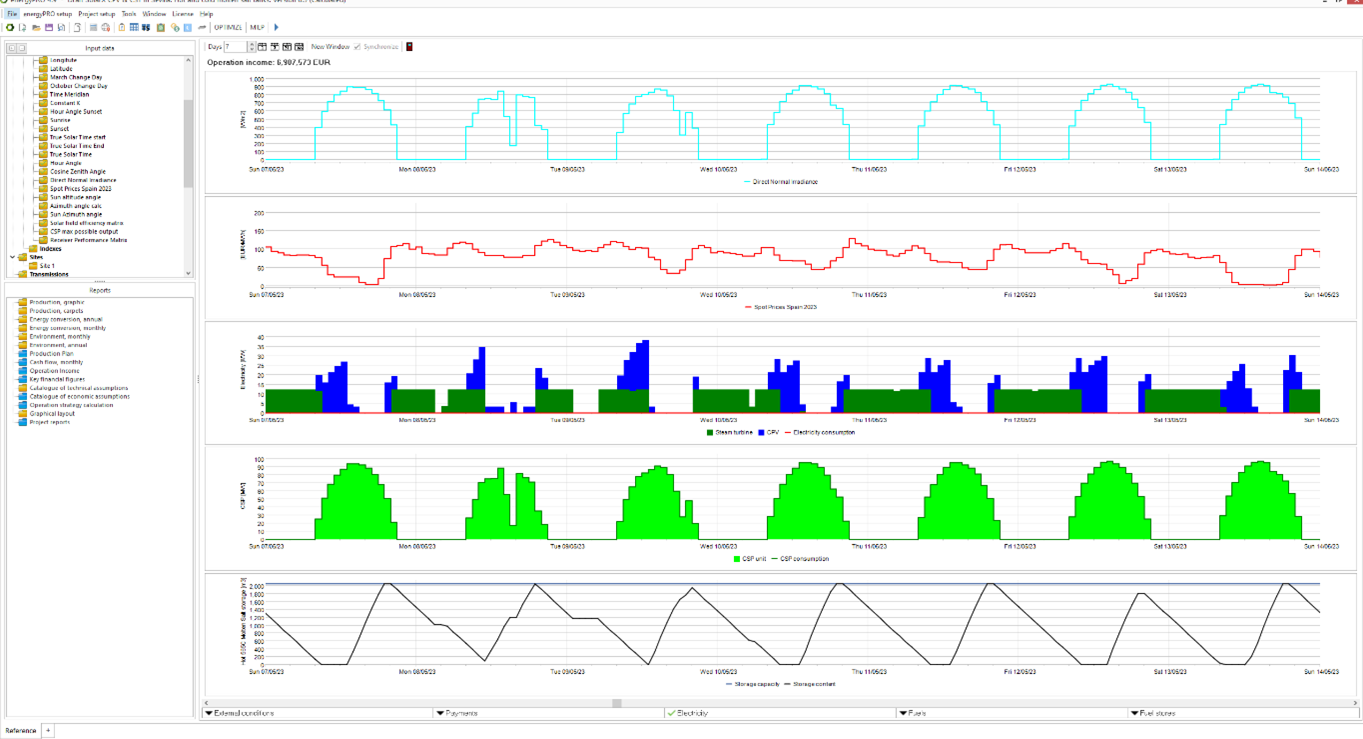
- Molten Salt Storage in energyPRO
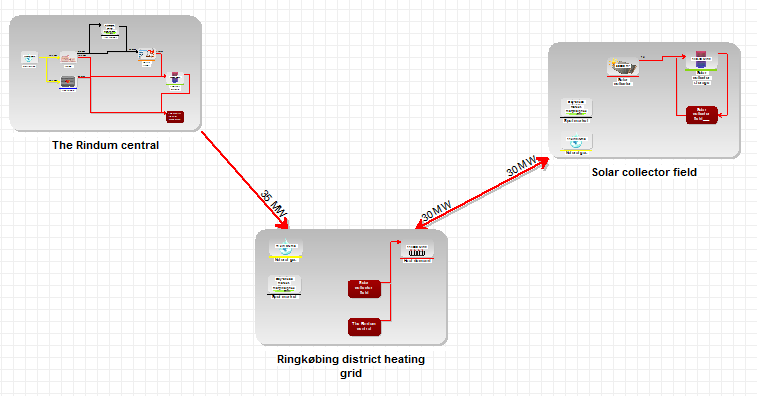
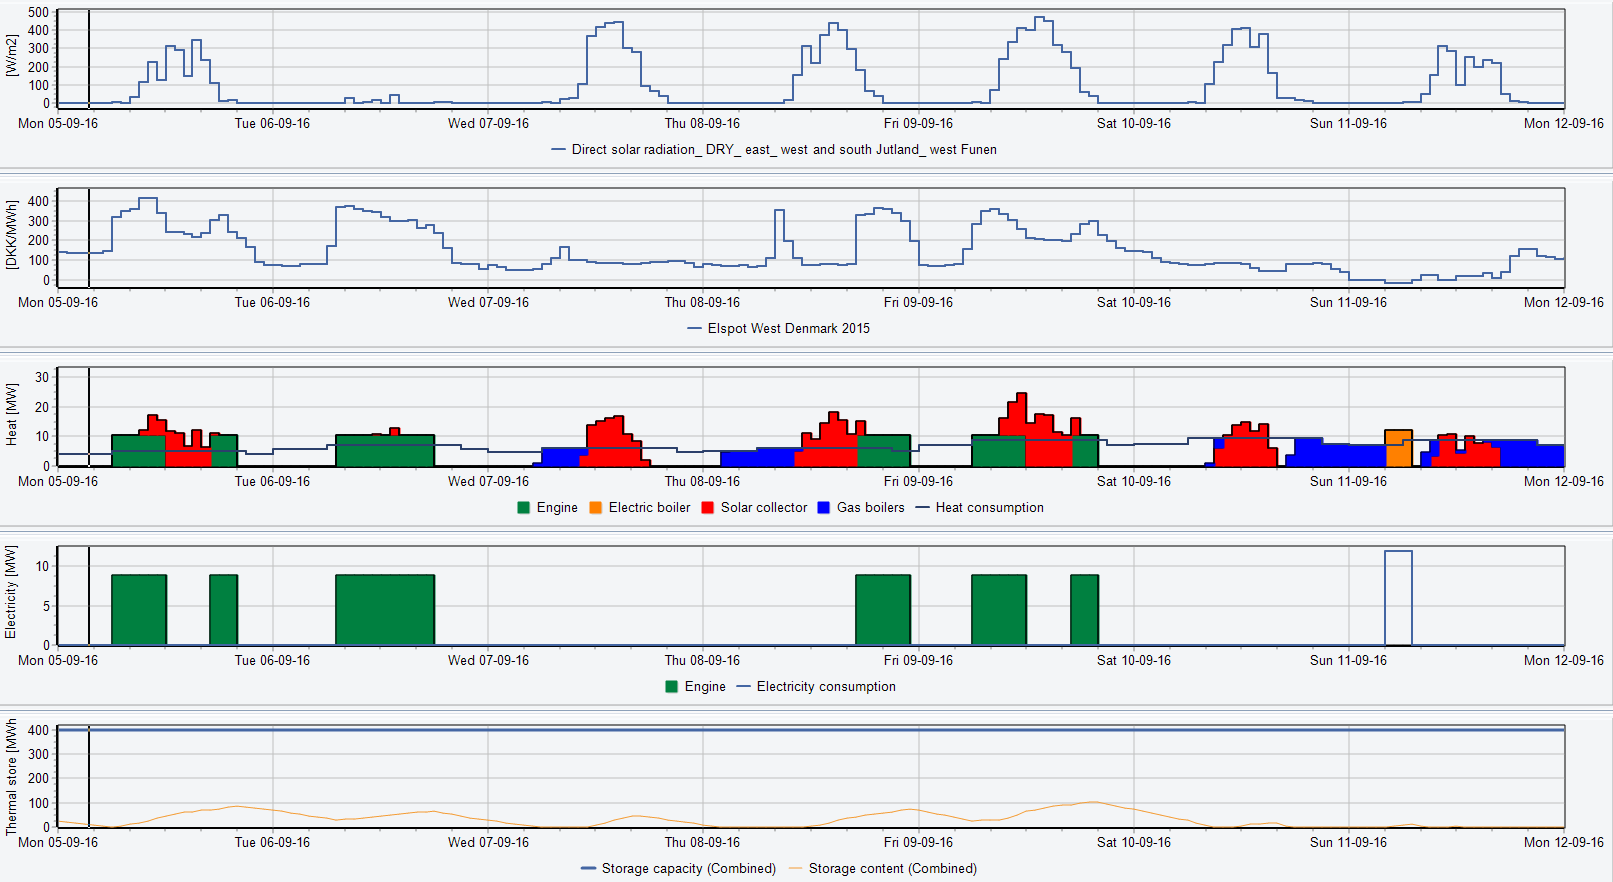
- Danish cogeneration plant and solar collectors in separate sites
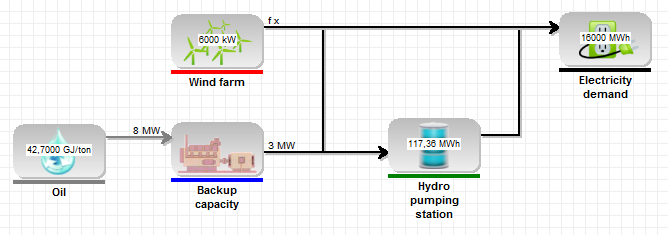
- Power plant and wind farm with electricity storage in island operation
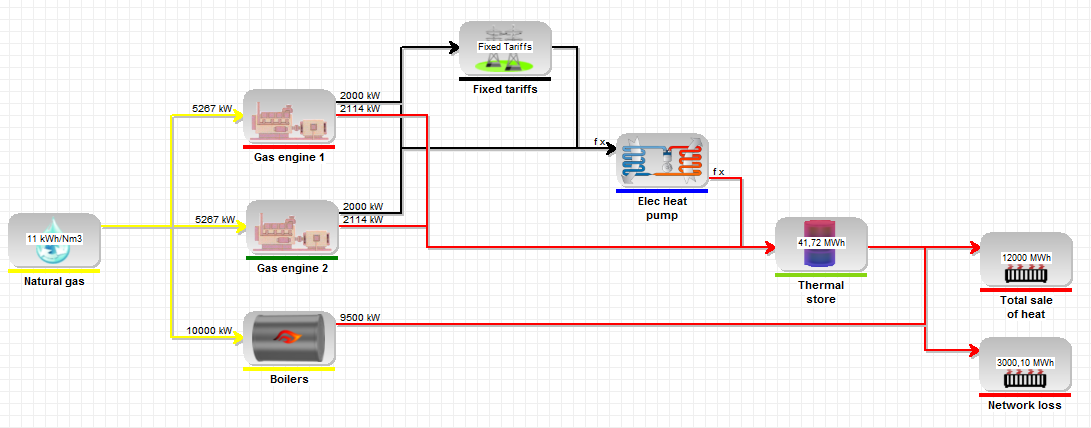
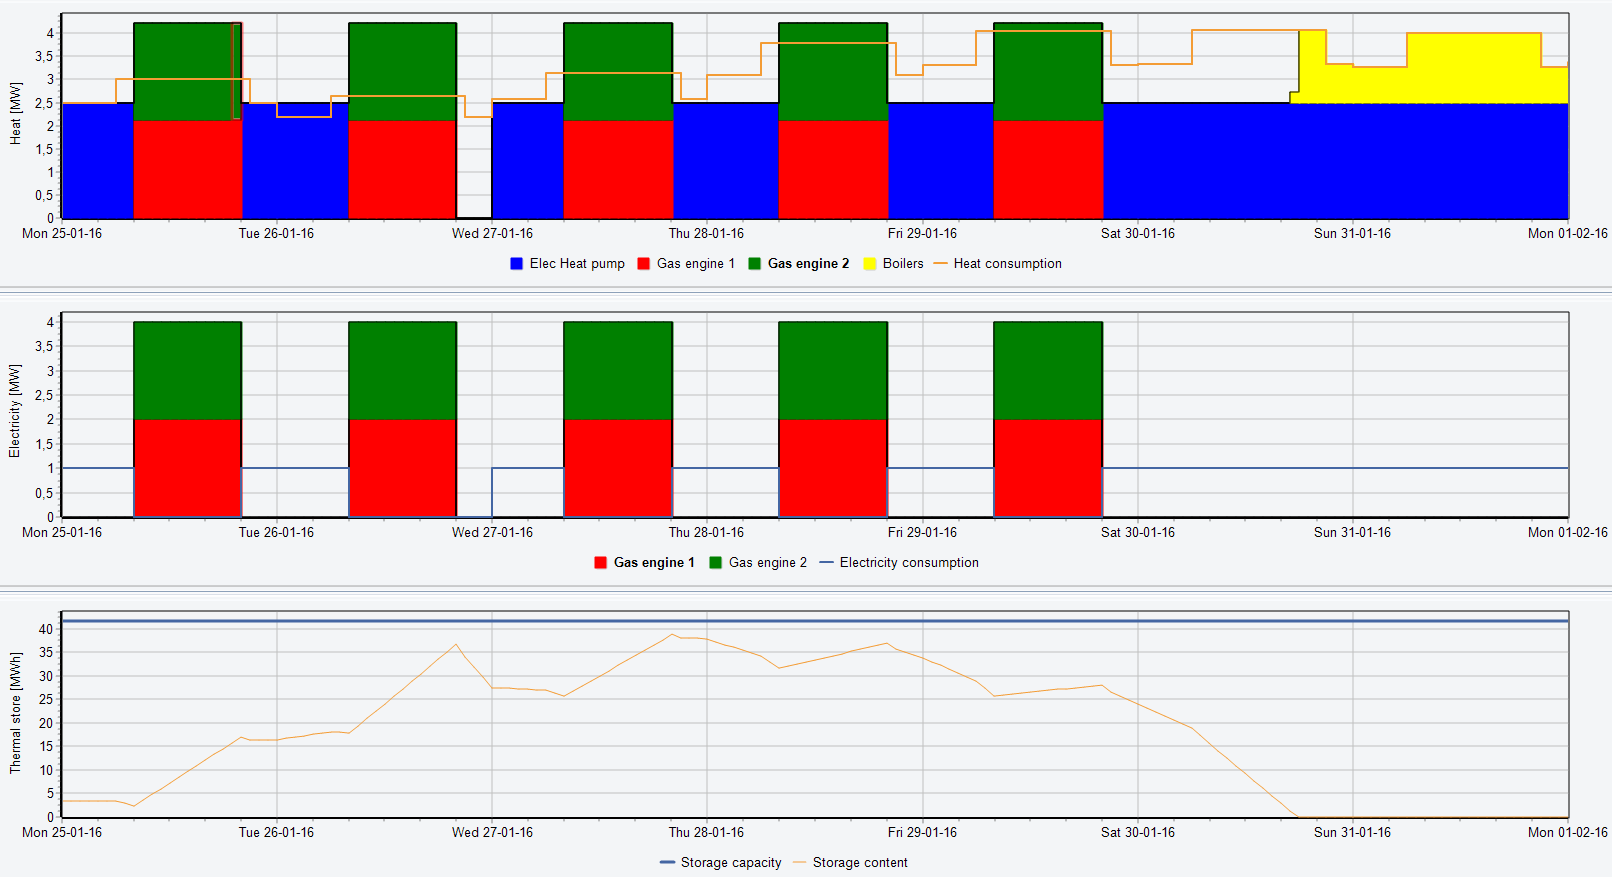
- Cogeneration plant and electric heat pump on fixed tariffs
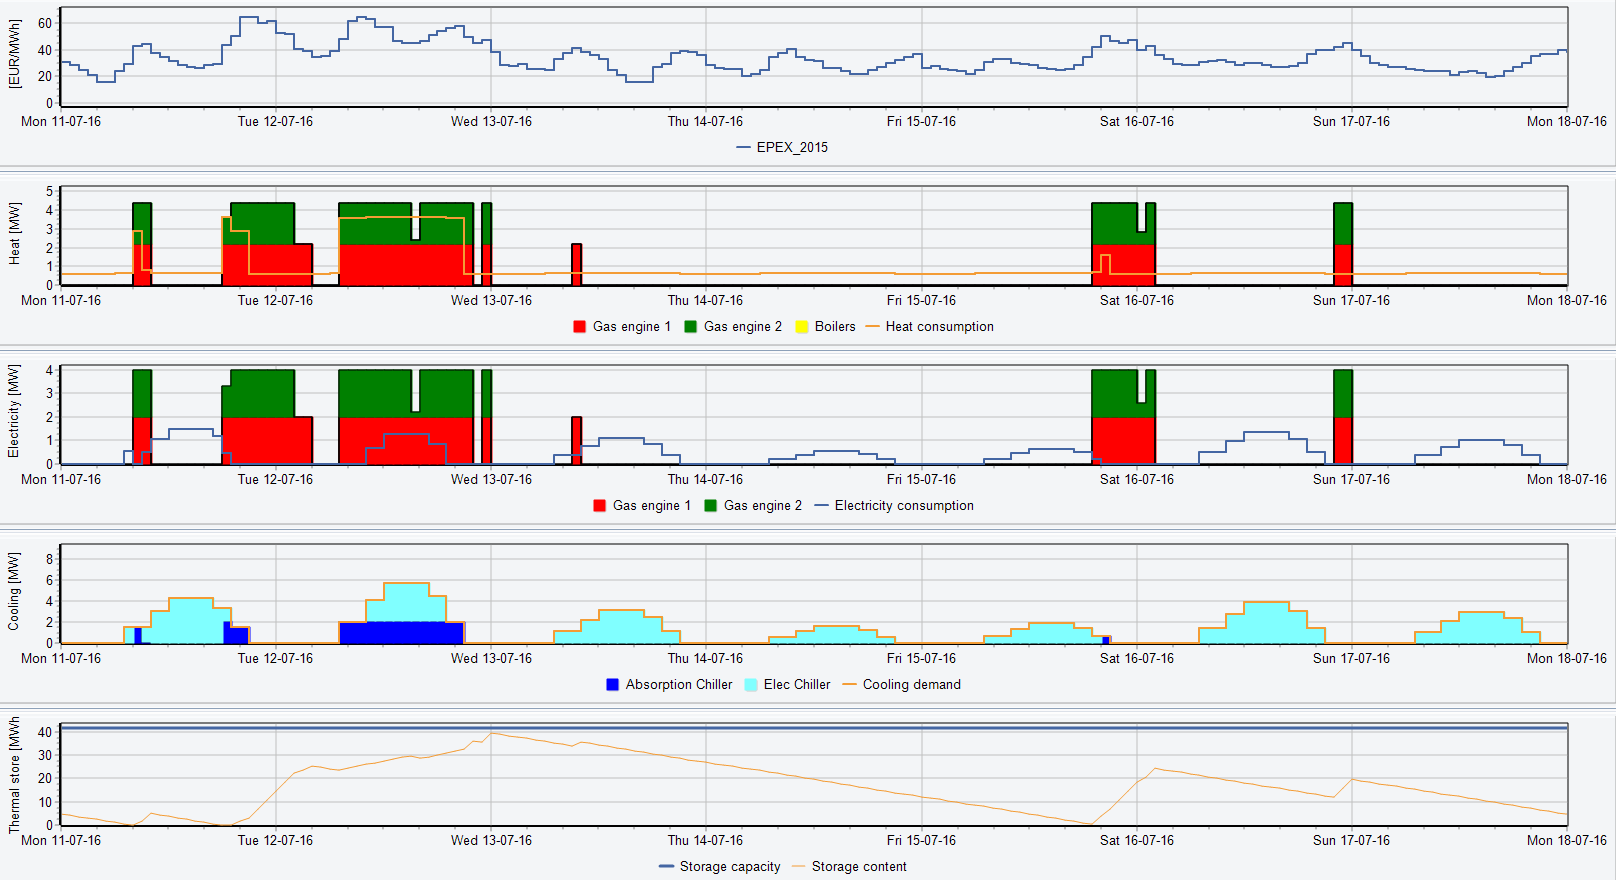
- Tri-generation plant on a Day-Ahead market
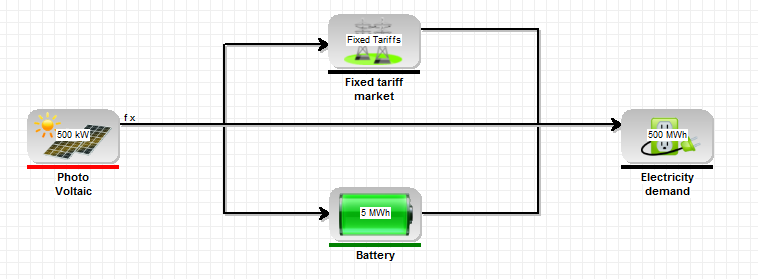
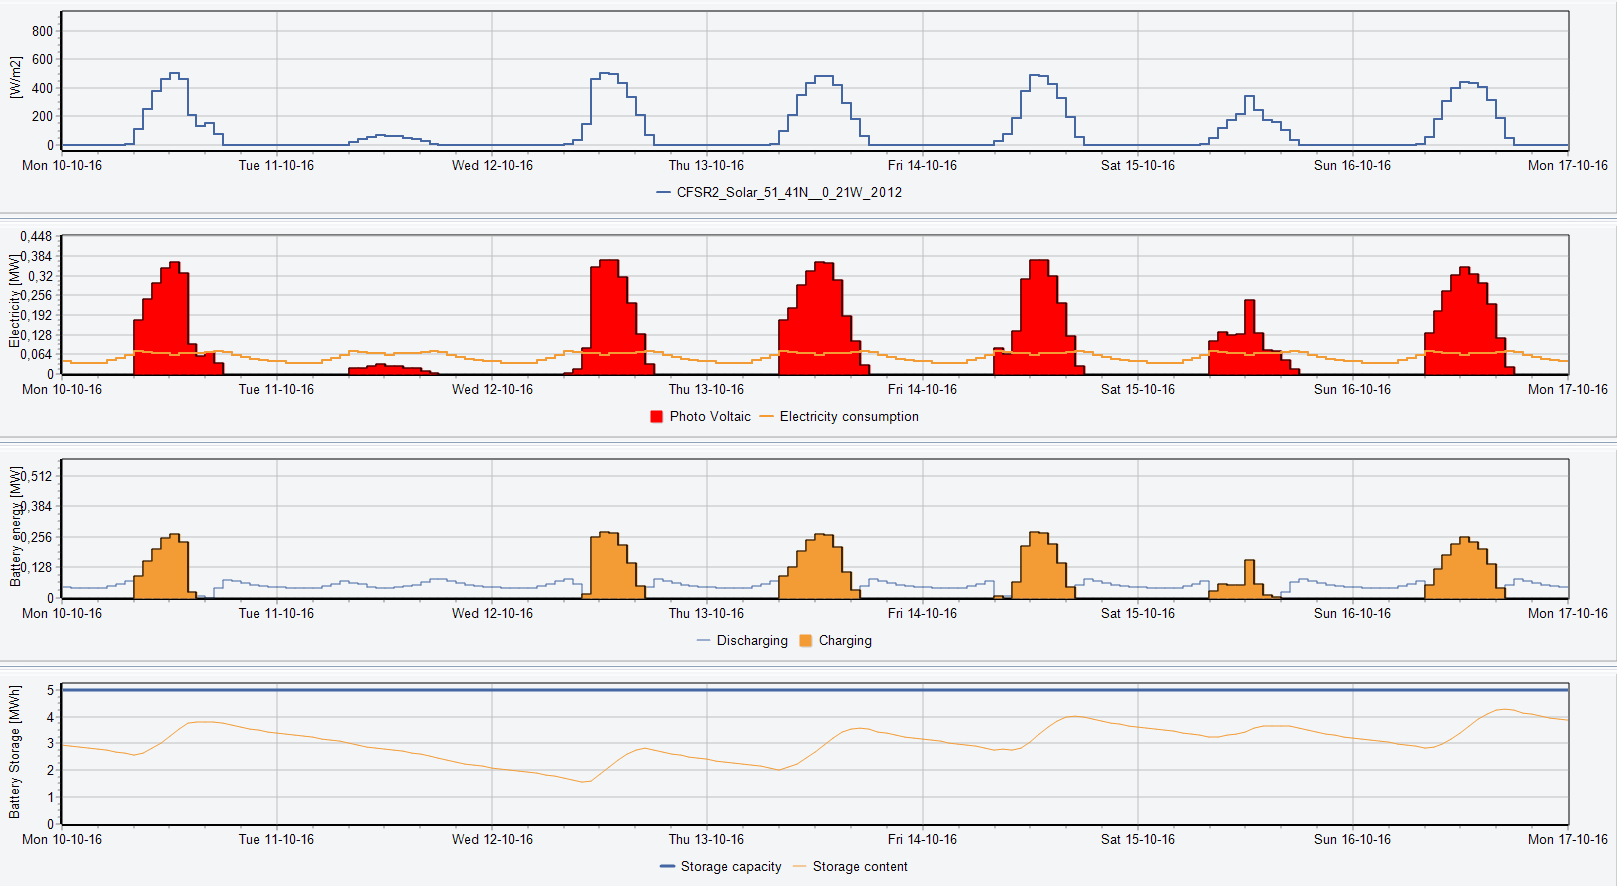
- Photovoltaic and battery on fixed tariffs
If you cannot find an example that is relevant for the system you wish to model, feel free to contact us at energyPRO@emd.dk
From installing energyPRO, a part of the installation contains a library of different examples and country specific datasets such as weather data and electricity prices. The default directory for this library is C:\energyPRO Data\.
From energyPRO these data and examples can be loaded and used for inspiration when setting up your own project.
Please have a look at this video where we visit a district heating plant in Denmark using energyPRO on a daily basis.